
Hubtime
I got pretty sidetracked during my 2012 Review and ended up making a new tool called Hubtime. It lets you graph your activity in a variety aways across Github repositories.
The inspiration came from Github’s own reports, but I made Hubtime because those reports are only at a repository level. I was looking to see patterns across the many repositories that I worked on over the year. It seems that Github agrees to some degree because they have since launched metric overviews on user profile pages.
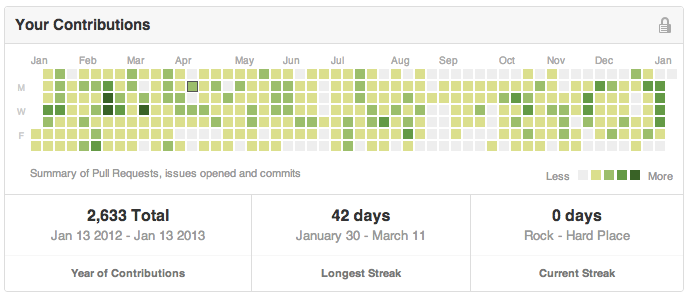
A 42 day streak! Hubtime has the data to make Hubtime do the same graph, but right now focuses more on reproducing the Github experience that is only now per repository.
$ ./hubtime.rb graph commits --months 3
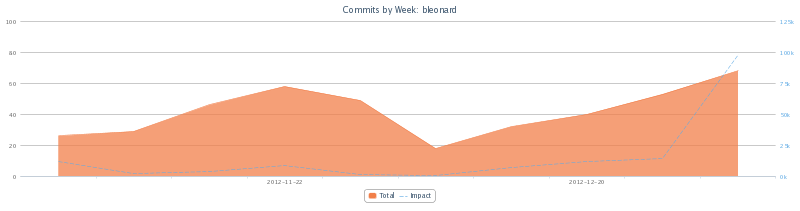
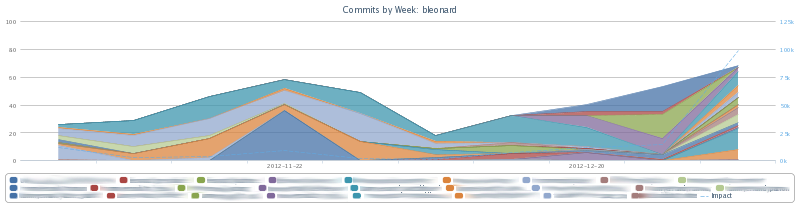
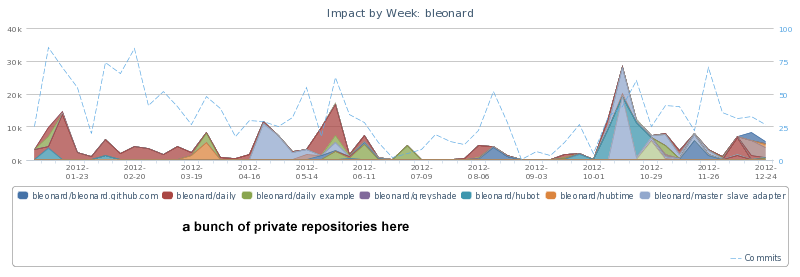
Graphing commits, additions, deletions, or impact can also be done showing the magnitude by repository.
$ ./hubtime.rb graph commits --months 3 --stacked
This was the first purely command line Ruby project that I have done. In addition to that, I learned several new things and tried some new approaches during development.
Commander
For no particular reason versus the alternatives, I decided to use the Commander gem to bootstrap the project. This gem take code like this:
And produces help documentation like this:
$ ./hubtime.rb impact -h

NAME:
  impact

SYNOPSIS:
  hubtime impact

DESCRIPTION:
  Graph your additions and deletions

OPTIONS:
  --months INTEGER
      How many months of history
  --user USERNAME
      Which Github user
It also parses the arguments and generally allows for getting right to the point.
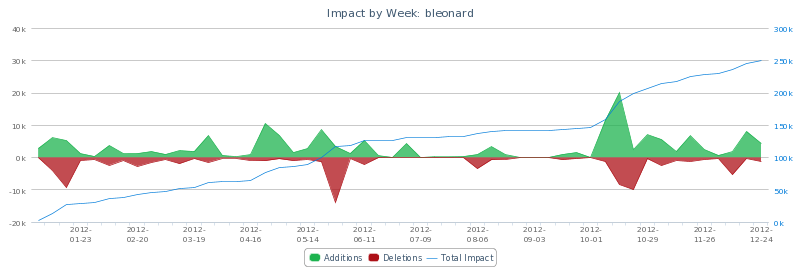
The point for me was making the impact graph, initially. To get there, I decided to use only Github’s API. In theory, I could have checked repositories out and done a bunch of git stuff locally. In retrospect, this would have been much more performant and maybe more useful in the long run.
Nevertheless, the first step was authentication. I made a command to enter the username and password. In the original version, I sent this to Github to get an OAuth token and did not store the password, just the token. Right before releasing, I switched to not use a client application as it would cause all users collectively to get 5000 requests total to the API as opposed to per user. This limit proved to be a problem. I unfortunately had to store the password locally somewhere and took a half-hearted attempt at obfuscation.
As I mentioned, the API limit seems very high but very quickly became a problem. The core issue is that the data I needed (additions and deletions of a commit) is not available on the commit list API. It is only available on the single commit endpoint. Thus, I used the list command to see what I did within all my personal and organization repositories and then queried each commit for the data I needed.
Caching
Because I am involved in 50+ repositories and have thousands of commits and there were some problems with paging in the API, I very quickly hit my limit. Even for performance reasons, I started looking for a good way to cache the results. It’s not like the commit I did last January is going to get more or less lines now, right?
As I was attempting to make this a short project, I didn’t want to write a caching layer and, for the first time, it occurred to me to use the VCR gem outside of a testing environment. It worked beautifully.
So what I would do is have my API usage timeout, wait a bit, and then get back to it. Or only do the most recent month, then do the last two months, and walk backwards in that way. It never repeated itself, particularly on the single commit queries. For cached queries, it was much faster too.
Performance
The caching helped, but it was still very slow. That’s a lot of waiting for Github to tell you stuff. I’m not sure how I’ve made it this long without really working on multiple threads in Ruby, but I decided to make it happen here. The first approach I took had a worker pool and each thread would work a single repository.
This dramatically sped up the fetching, of course. At this point in my development, all the requests were cached already, but it was still 5x faster with 8 threads. I felt pretty good about that, but it could still be better. It wasn’t 8x faster because one of the repositories had significantly more activity so, in the end, there was still just a single worker working for a significant amount of time. To remedy this, I dealt with each repository serially and moved the parallelization to the window and commit levels.
The parallelization was in two spots now, but it also made the output simpler as my puts statements of what repositories it was working weren’t all coming in at the same time.
Threadsafe
I felt pretty happy about my multithreaded experiment and decided to jam through some of the other members of my team. Things got weird.
All this time, I had been using the multithreaded code on VCR-cached queries. Clearing the cache or looking up the activity of another user caused the recording to go back into effect. After much confusion, I realized that VCR was not threadsafe and that the “cassettes” would have have the output from one query and half from another. The first time through it would be fine, but then when trying to use the recording the next time, it would fail to parse and blow up.
I was in this far already and didn’t want to ditch the project, even though I already had my graphs for my review. I had also tasted the speed (or at least the lack of absurd slowness) and couldn’t go back to running it in one thread, so I wrote my own simple cacher that was used in threadsafe way and removed VCR. For good measure, I also cached the final results needed to draw all the graphs. This made subsequent commands instantaneous, which was very satisfying. Looking back, I’d say it was close to a russian doll caching strategy.
In end, the structure looked like this:
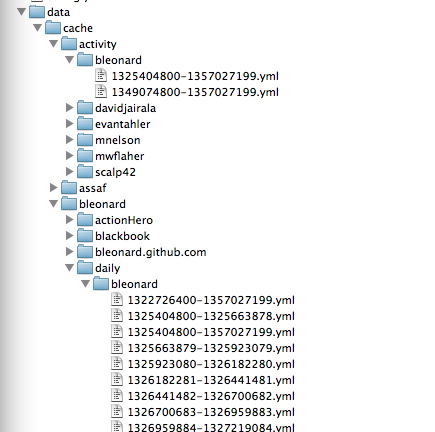
Where all of those windows of time. The ‘activity’ ones contain various stats. They are all together, but if I just had one repository, it would look like this (except with all the years, months, and days of each:
And the commit windows contain shas for the user during that window:
It also caches the commits themselves:
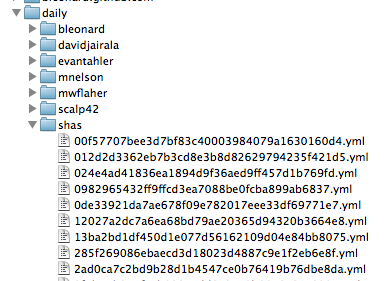
The contents of each is the serialized version of the Hashie::Mash that Octokit returns.
Charts
Finally, I used HighCharts to make the charts themselves. It was kind of funny to be building a command line tool and not really have a way to show charts, so I actually started with a table and a sparkline. I was looking for the those pretty pictures, though, so I fell back to doing things in a web way. In this case, I used ERB to render a page to an HTML file and then used the command line open command to launch that file.
A few more graphs:
$ ./hubtime.rb impact --months 12
$ ./hubtime.rb graph impact --stacked
$ ./hubtime.rb pie